|
|
|
I tested the dynamic range of the FujiFilm S3 pro digital SLR in two ways:
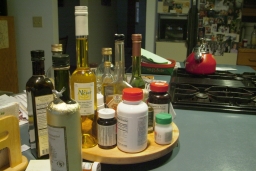
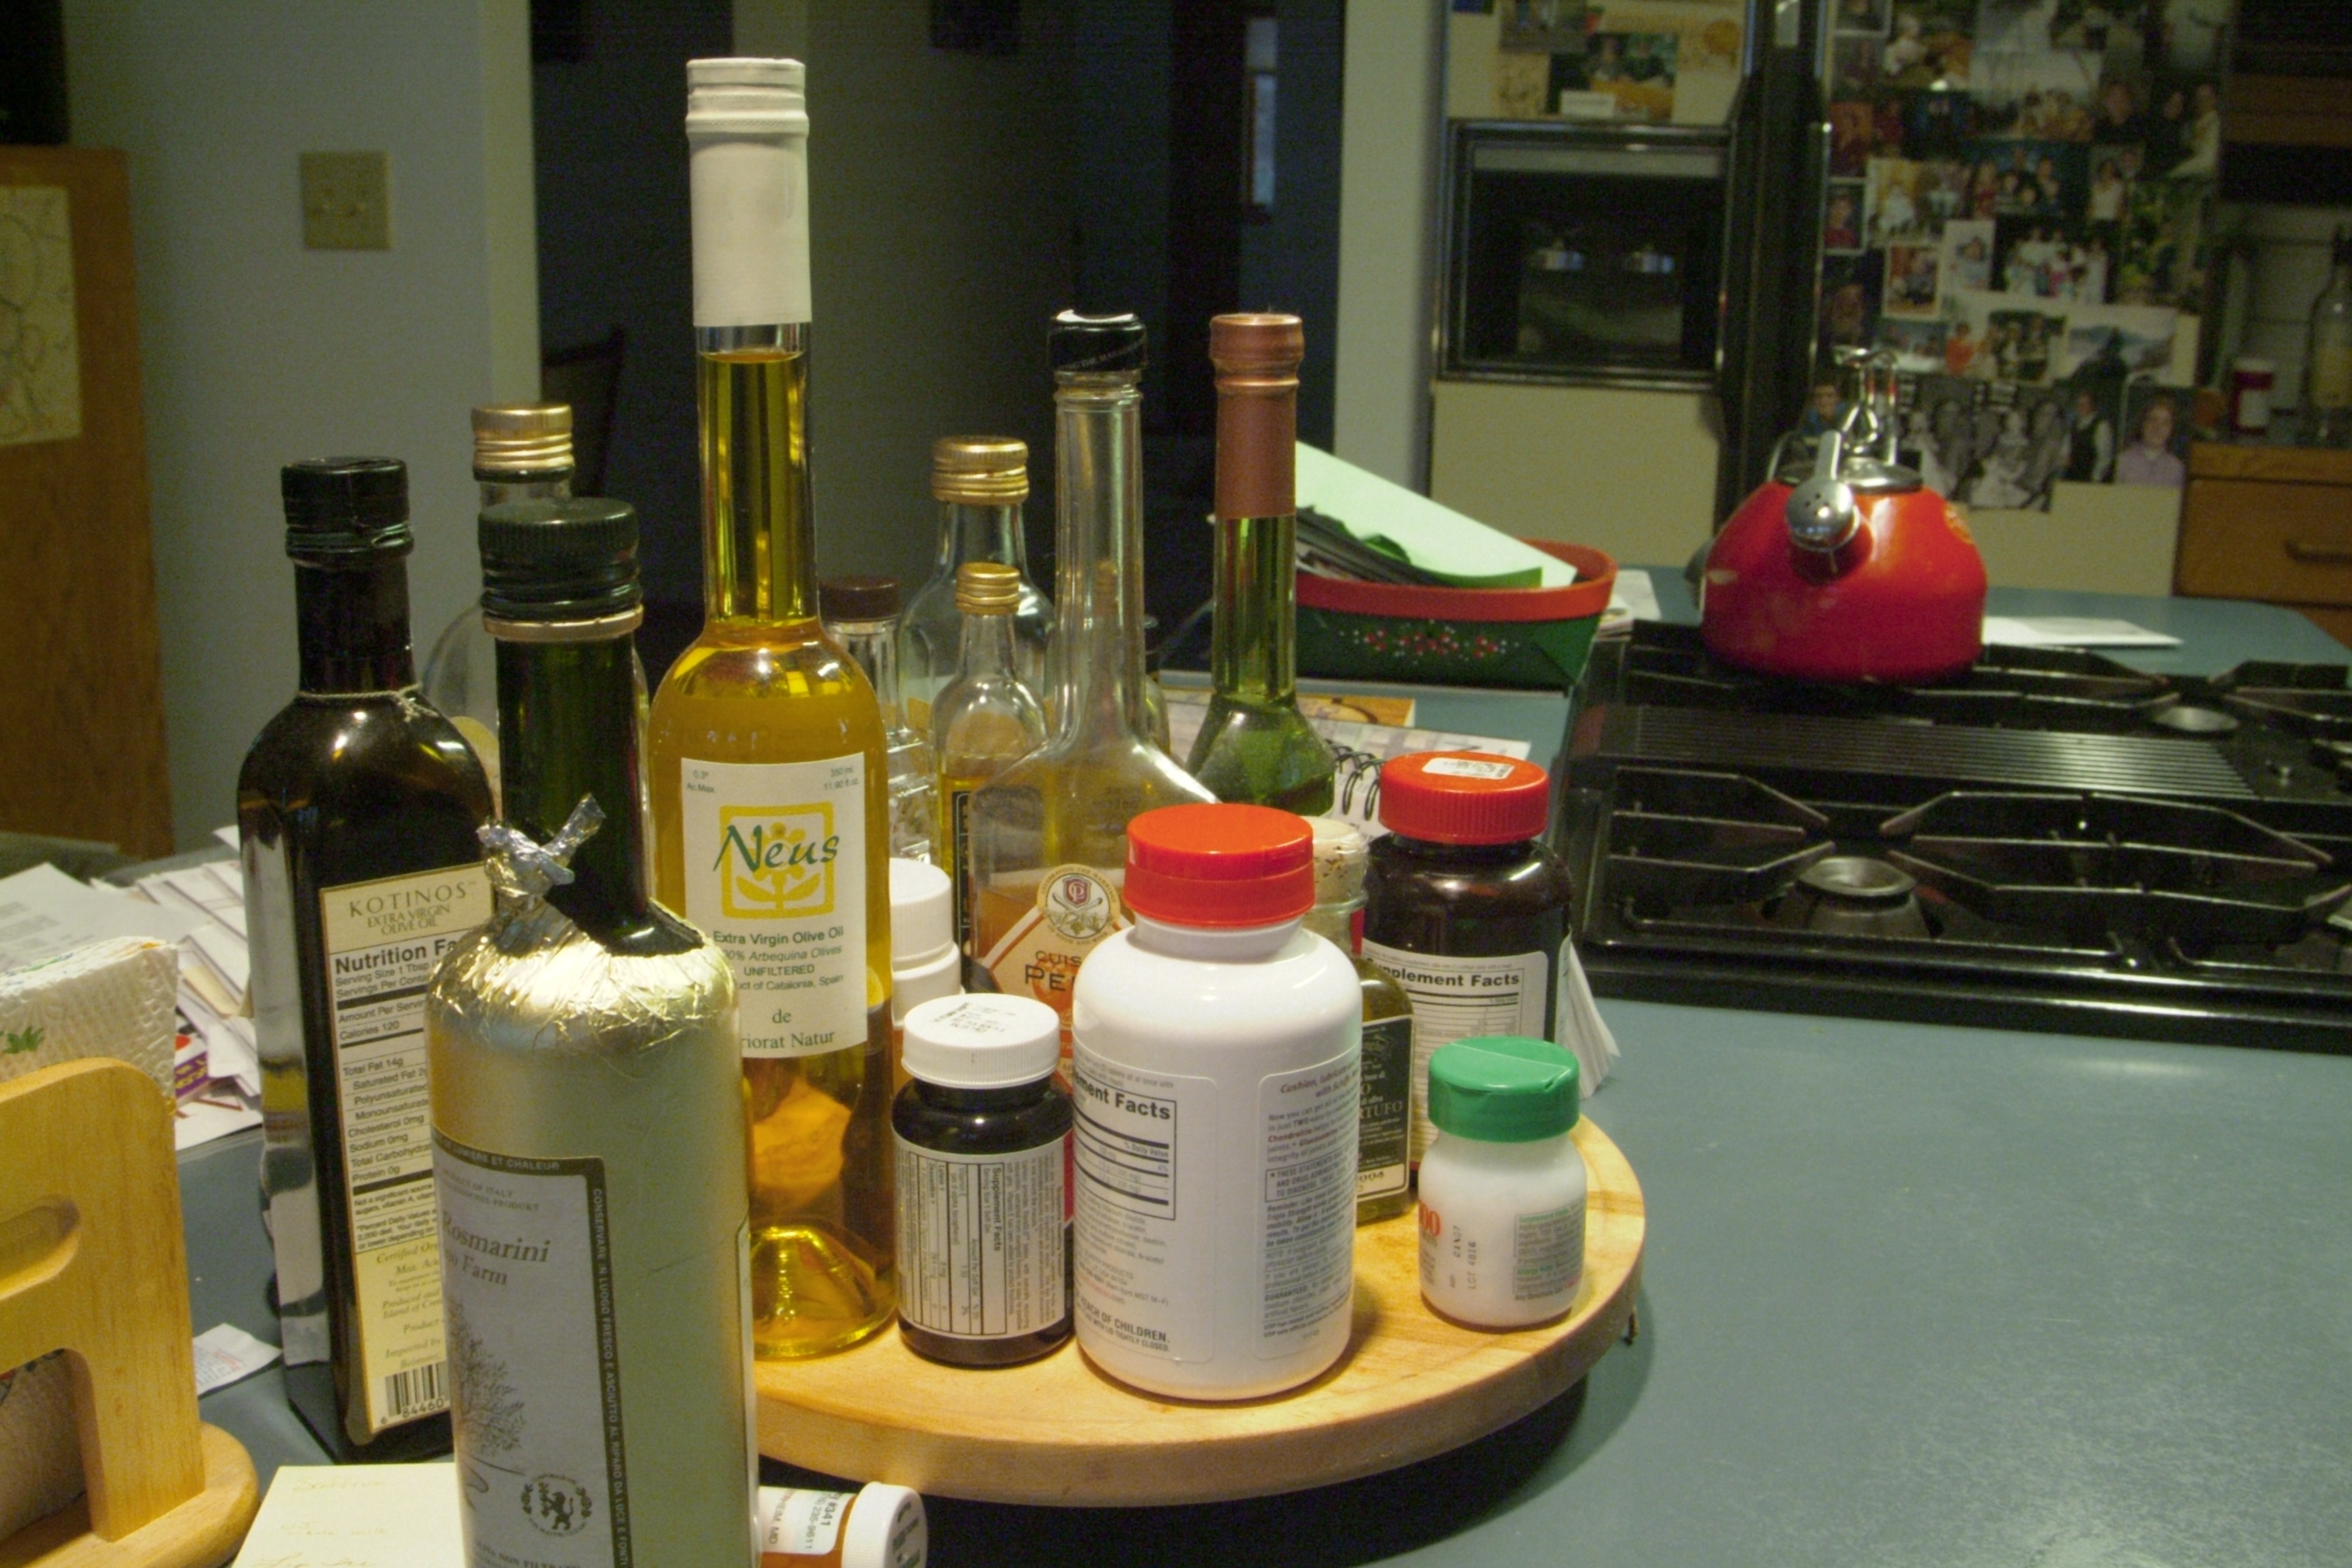
Right at the top, let me offer you two pictures that you can use to compare the Standard and the Wide dynamic ranges of the S3. See if you can tell the diffence before you read this. Then, after you understand what the camera does technically, see if you can then pick up the differences. Yes, they are subtle. Oh, and lest you doubt: the pictures were taken identically except for changing the dynamic range of the camera; in-camera 6MP jpeg images were written and no other post-processing was done.
|
|
|

Click for half-size or quarter-size images.
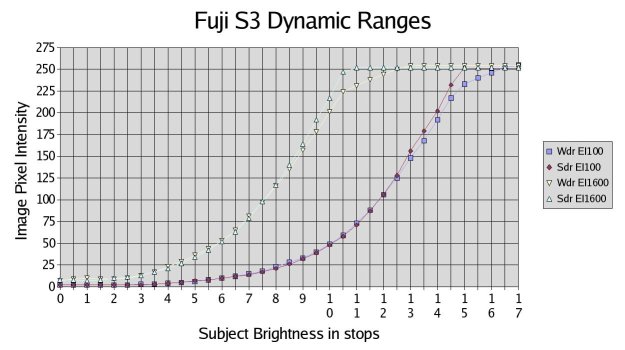
Next, here's a graph of the results of my testing of the S3's dynamic range versus itself and the A2: There are three curves:
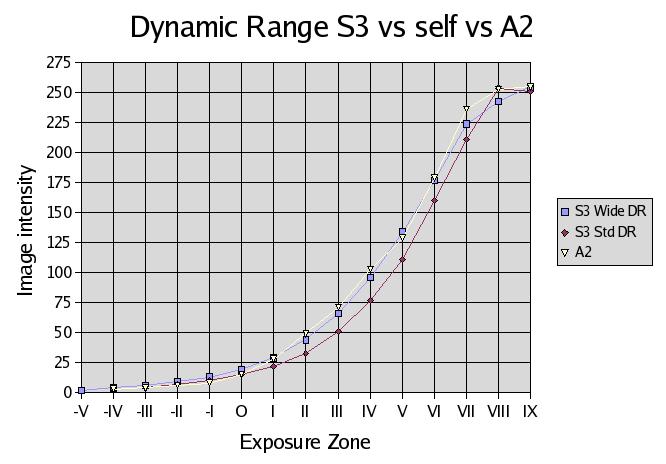
Note two things:
| Zone | S3 Wide DR | S3 Std DR | DiMage A2 |
| -V | 2 | ||
| -IV | 4 | 3 | 3 |
| -III | 6 | 4 | 4 |
| -II | 9 | 7 | 6 |
| -I | 13 | 10 | 8 |
| O | 19 | 15 | 15 |
| I | 29 | 22 | 28 |
| II | 44 | 33 | 49 |
| III | 66 | 51 | 71 |
| IV | 96 | 77 | 103 |
| V | 134 | 111 | 129 |
| VI | 177 | 160 | 179 |
| VII | 224 | 211 | 236 |
| VIII | 243 | 254 | 253 |
| IX | 255 | 251 | 255 |
| X | 255 | 251 | 255 |
| XI | 255 | 251 | 255 |
Summary:These curves show that the S3 gains about 2 stops of dynamic range over the A2 and over its own "standard" dynamic range. The image processing algorithm puts one extra stop at the top of the curve, diminishing or postponing "blocking" of highlights, and one at the toe of the curve, preserving shadow detail.
But will this be noticeable in photographs?
Well, that's going to depend on the subject brightness range and your exposure technique:
What about that long, long "toe" on this curve?
Zone Zero is the subject value that traditionally was assigned to the deepest black that photographic paper could produce. The fact that both of these cameras record detail 3 to 4 stops below this value means two things:
The expanded dynamic range of a good sensor does not expand the brightness range of your printer, of photographic paper, or of your monitor. Thus, when a camera such as the S3 is able to record an image brightness range that is 2 additional stops, it means that more values must be squeezed into the same print scale: the print looks flatter, not snappier.
The S3 compensates for this by keeping the mid-range contrast about the same, and compressing the top values (note the "shoulder" of its characteristic curve in the top graph).
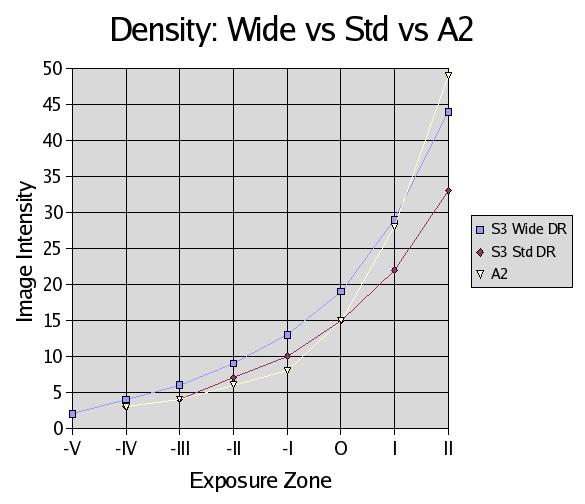
This graph shows that the differences between the Wide and Standard dynamic range settings are to gain one stop of highlight texture and one stop of shadow texture. That is, the dynamic range is extended two stops. The necessary side effect of this is to produce a lower gamma (contrast) in the mid-range values. Unsharp masking or contrast masking can compensate for this, but this does require post-processing time.
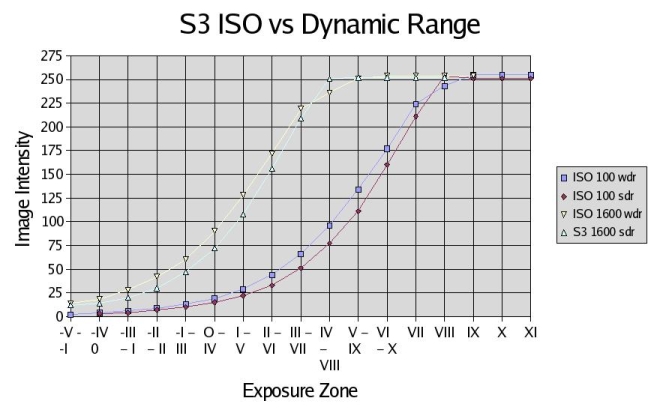
Note that this graph shows that the higher ISO setting does not make the sensor more "sensitive." The ISO setting simply instructs the image processor to translate pixel intensities to higher image values. Note that the ISO 1600 curves saturate 3 to 4 stops before the ISO 100 curves, and that the ISO 1600 curves lighten shadow values about 4 stops (as they should! -- ISO 1600 is four stops faster than ISO 100).
Thus, when you shoot at higher ISO values, you throw away the high values and have a constricted dynamic range. If you want to preserve the whole dynamic range of a contrasty scene, you must shoot at the camera's lowest available ISO and carefully place the important bright values below the pixel saturation threshold (by using the camera's histogram or it's pixel-saturation warning).
Then, in processing you can choose what's worth keeping and what can be obscured in highlight or shadow.
First, remember that exposure calculations are standardized on middle gray, and that the algorithms of these cameras place this middle tone quite near the pixel-saturation value. (They do this to keep the bright values "snappy" but the cost is muddy shadows.)
Second, remember that pixel saturation and loss of image texture occur in these digital cameras three stops (A2 or S3 std. dynamic range) or four stops (S3 Wide DR) above middle gray.
Third, at the lower ISO settings, there's a long "toe" that preserves detail. This is a safety reserve that you can use.
These things mean that you can "underexpose" images by one or two stops (three if the brightness range of the subject is small) in order to guarantee against highlights blocking up. The price of doing so is more work in post-processing; all your images may print too dark unless manipulated. The advantage is that it's much easier to create a terrific print if you leave yourself room on both ends of the characteristic curve.
Text and images, except for the photo of the CCD sensor, Copyright 2005, Daniel L. Johnson. All rights reserved. Permission is hereby given for non-commercial use of these words and images as long as they are distributed without charge and without alteration.
