Both raw and jpeg images were recorded; this example uses the jpeg images, as I was interested in determining the net effect of the sensor plus image-processing technology (the next page uses raw images). The camera's settings were: ISO 64, Custom white balance using the standard target as the source, "soft" sharpness (the minimum of the three available grades of edge enhancement; all look to be a 3-pixel radius at various intensities), minimum contrast (11 steps available from -5 to +5). The lens was wide open (f 3.2) and shutter speed was used to alter exposure.
The images were copied to my computer, and the gimp's curves tool was used to measure the intensity of the target image at each exposure: the curves tool displays a histogram; the target has a narrow range of luminance, and the curves tool enabled me to ensure that I measured the peak point of each image. I made a table of these numbers, and from this created a simple graph, below.
Compare the DiMage curve with the curve below it, from a classical B & W film, Kodak Plus-X.
Note in the digital characteristic curve, above, the sharp, flat "shoulder" that is due to pixel saturation. Compare this with the Plus-X characteristic curve below. Note the gentle shoulder at the top, and the short toe compared with the digital camera. A standard paper photographic print enhances the gradual "shoulder" in the high values because the highlights print in the "toe" of the paper's curve.
The result is that digital images, in comparison with film-amd-paper photographs, have harsh, blocked high values and muddy, flat low values. There are several techniques for changing this. An easy one is to use the Curves tool to "soften" or flatten the high values and to increase the contrast of the low values, as shown in the following illustration.
In this example, I have taken a correctly exposed image (Prague, Czech Republic, looking south up the Vltava River, July, 2004) that looks muddy and simply yanked the values curve upward in the high values and moved the black point up to the lowest values in the image. The photo on the left is the original, the one on the right is the edited image, and the alteration is shown on the curves tool.
To view a full-size XSGA image of this illustration, right-click on the image and choose "Open in new window."
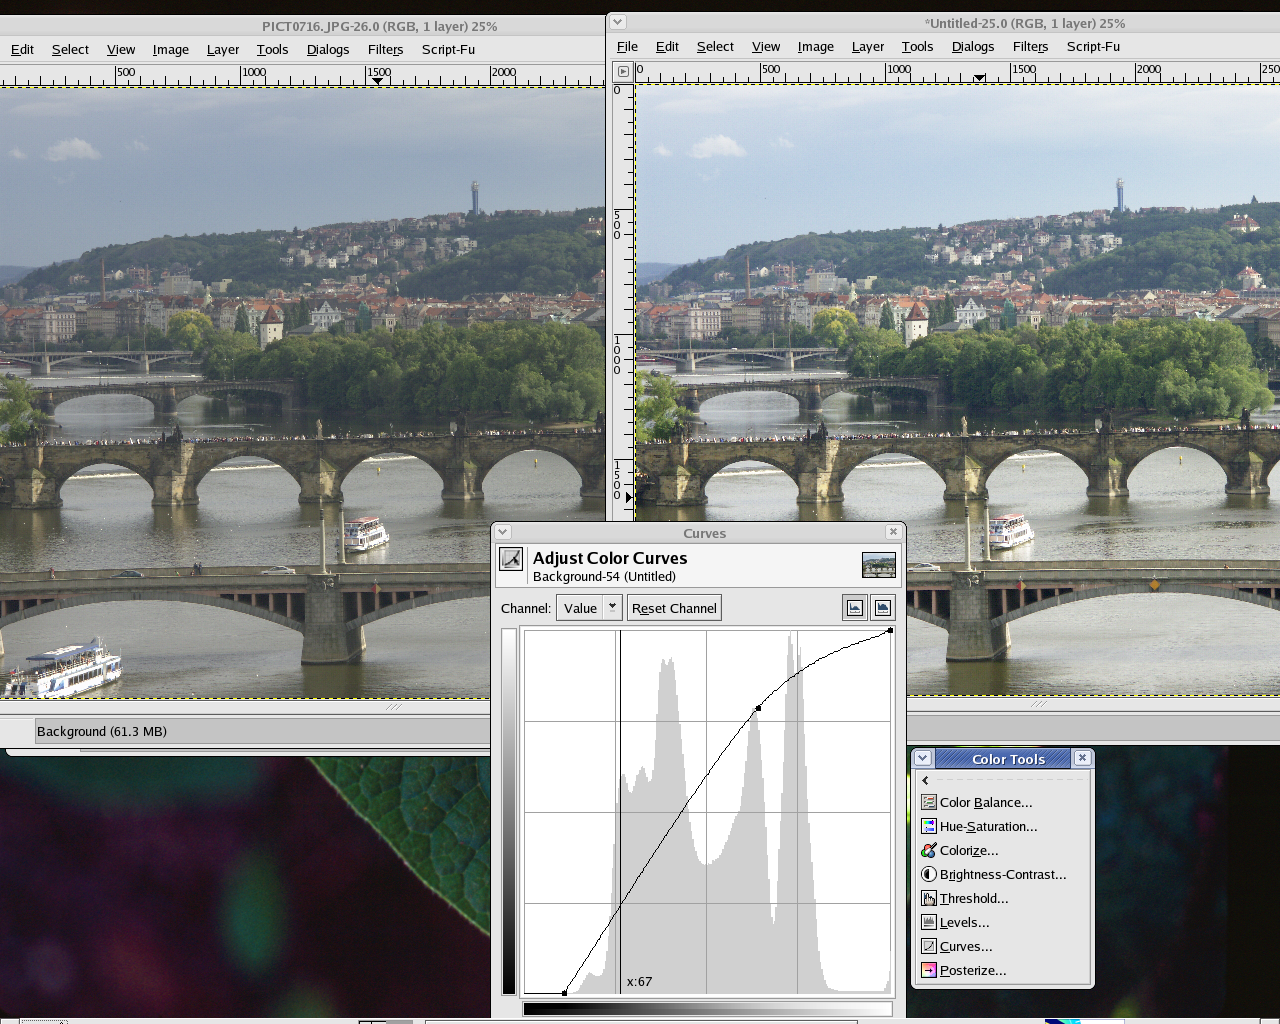
Note that the curves tool very helpfully displays a histogram of the density values, and that there's a gap between the lowest possible densities at the left and the lowest densities in the image. I've moved the left end of the value curve to near the lowest values in the image. I did not move it into the histogram because I wanted to retain shadow detail in this case.
I did not move the right end of the curve to be adjacent to the upper end of the values of the histogram for two reasons:
There are, as I said, other ways to achieve this effect. If you shoot camera raw images, you can adjust gamma and shadow density. Some software allows you to create a desired response curve and filter the raw values through this curve. But for the standard, quick-and-easy .jpeg file, this is a quick-and-easy technique for making images that have softer highlights and snappier mid values.
Next topic: Gamma management using dcraw and the gimp.